
SHAPES, PATHS AND WAVES: THREE STORIES FROM THE INTERFACE OF PURE AND APPLIED MATHEMATICS
By Vidit Nanda, Associate Professor of Mathematics at Oxford and a fellow of Pembroke College
Legend has it that the wicked king Tantalus once attempted to hoodwink the entire pantheon of Greek gods by serving up his own son to them at a lavish dinner party. In response, Zeus – never one to take kindly to this sort of mischief from mortals – confined Tantalus to an eternity of standing under a bountiful tree in a shallow lake, with both fruit and water remaining just out of reach. Public perception of research mathematics often finds itself in a similar position: perpetually suspended in the wilderness between science and art, unable to fully identify with either.

When faced with severe economic constraints, it appears reasonable to try and separate mathematics research into pure and applied, with the aim of regarding the former as ars gratia artis and the latter as science that more directly benefits society at large. In extreme cases, these distinctions are easy to make: one can confidently assert that any paper titled “Langlands functoriality in characteristic p” is pure and that “Models for vascular tumour growth” is applied, while remaining cheerfully ignorant of both topics. As research gets more specialized, such extreme cases receive far more attention than the bulk of mathematical output, which further cements the impression that mathematical practice can be neatly bifurcated into two disjoint categories. This narrative has been so successful that several universities have cleft their mathematics departments in twain, with the dismembered pieces often housed in separate buildings.
However well-motivated and convenient this dichotomy might seem at first glance, the truth of the matter is that mathematics is a unified whole: abstract theoretical results eventually percolate through to other scientific realms, often after considerable efforts have been invested in them over several decades. Conversely, applied domains serve as both inspiration and testing grounds for new theoretical frameworks. This feedback loop is a vital, fascinating and complicated process, often spanning several decades. As a consequence, it becomes quite challenging, if not impossible, to predict which fraction of the work that is considered pure mathematics today will become an indispensable tool of applied mathematics in the future. I want to describe three lesser-known instances of the pure-to-applied progression here. My hope is that these stories will shed some light on the underlying unity of mathematics and on the inner workings of mathematicians.
I. Morse Theory and The Shape of Data

In the 1930s, Marston Morse built the body of abstract results which bears his name to this day. Fellow mathematician Stephen Smale called Morse theory the greatest contribution of American mathematics in his 1978 obituary of Morse. The basic theme is that we can understand the topology, or shape, of smooth geometric spaces by examining the local structure at those points where the derivative of a generic real-valued function vanishes. There are, for instance, only four points whose local data is required to reconstruct the torus illustrated here. I promise not to unleash any gory details; but if you are curious, there is a lively account of Morse theory and its mathematical achievements in Raoul Bott’s survey titled Morse theory indomitable.
Let us fast-forward 8 decades from Morse’s heyday to the year 2011, when a team consisting of mathematicians Monica Nicolau and Gunnar Carlsson and biologist Arnold Levine successfully discovered a new type of breast-cancer. They were armed in this quest not with cutting-edge data, but with a discrete adaptation of Morse theory. Indeed, the microarray dataset analysed in their paper had already been well-mined using traditional statistical tools. Their tool of choice is called Mapper. Much like Morse theory, Mapper describes the structure of geometric shapes from the lens of a generic real-valued function. The key difference between the two scenarios is that the geometric shapes analyzed by Mapper are discrete and noisy, consisting of clouds of data points rather than smooth spaces. Ideas inspired by Morse theory continue to play an enormous role today in topological data analysis.
II. Iterated Integrals for Handwriting Recognition
The path space of a shape X is (unsurprisingly) the collection of all smooth paths lying on X. Starting from the mid-1950s, Kuo-Tsai Chen produced a remarkable series of papers relating the shape of any X to that of its path space via a theory of iterated integrals. In ordinary two-dimensional space, each such path is described by a function sending real numbers t (lying between 0 and 1) smoothly to points (x(t),y(t)) in the plane. Every sequence of x’s and y’s produces an integral – here, for instance, is the triple integral of arising from the sequence xyx:

(By x’(t1) I mean the derivative of x with respect to t evaluated at t1, and so forth.) Chen showed that the numbers obtained by computing these integrals for all possible sequences of x and y almost completely characterise the given path.
It took Herculean efforts by Terry Lyons, Ben Hambly, Peter Friz and other mathematicians across twenty years to transport Chen’s theory away from its smooth geometric origins and reformulate it to work with noisy rough paths. These iterated integral evaluations (now called path signatures) have since enjoyed an award-winning resurgence in stochastic analysis and partial differential equations. Chen had proved in the smooth case that higher-order signature terms arising from long sequences are polynomial combinations of lower-order terms arising from short ones. This observation has made the (finitely truncated) rough path signature an excellent feature map in machine learning tasks. In 2013, data scientist Benjamin Graham demonstrated that augmenting neural networks with these path signature features vastly improves their ability to recognize handwritten characters in traditionally challenging scripts. Chen passed away in 1987, but it might have pleased him to learn that one of these scripts was his native Chinese.
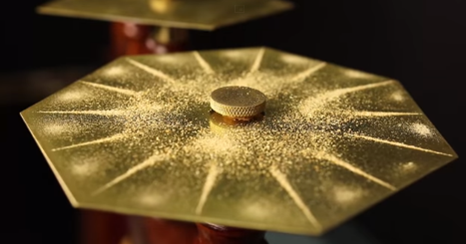
III. From Sound Waves to Data Visualisation
Physicist Ernst Chladni published a remarkable book in 1787 detailing some of his experiments with sound waves. You can recreate these by sprinkling lots of salt on a thin metal sheet and vibrating that sheet at certain resonant frequencies. The grains will automatically reassemble into mesmerising patterns which depend on the shape of the metal plate. There is a linear averaging operator called the Laplacian, which acts on smooth real-valued functions f defined on the plate-shape. In its most elementary form, the Laplacian Δf of a function f(x,y) is a sum of second partial derivatives:

If f satisfies Δf = –λf for some positive number λ, then we call f an eigenfunction of Δ with eigenvalue λ. These eigenvalues coincide with the plate’s resonant frequencies, and the salt from Chladni’s experiments collects wherever the associated eigenfunction evaluates to zero. Eigenvalues and eigenfunctions of Laplacians constitute subjects of intense mathematical study, starting with the seminal work of Hermann Weyl from 1911.
Almost fifty years after Weyl’s paper, Lothar Von Collatz and Ulrich Sonogowitz created spectral graph theory. Here instead of smooth wave-functions on plates, we have functions defined on vertices of graphs. The Laplacian, now suitably discretised, becomes a matrix whose eigenvectors are real-valued functions defined on the vertices with various magical properties. Perhaps the biggest scientific impact of Laplacian eigenvectors has come through spectral clustering. Given data points embedded in a very high dimensional space, one often wishes to visualise them in low dimensions, with “low” meaning ideally two and definitely no more than three. Naturally, the goal is to preserve distances between the data points to the extent possible. The standard technique for doing this is to build a nearest-neighbour graph by inserting edges between nearby data points, and using Laplacian eigenvectors of this graph (corresponding to the lowest two or three eigenvalues) as Euclidean coordinates. So anybody who has used popular tools such as DBScan or UMAP to better see their data has stood on the shoulder of a giant Laplacian.
EPILOGUE
To be clear, it is remarkably difficult even for mathematicians to answer questions like “Is mathematics science or art?” in anything resembling a satisfactory manner. I have encountered breath-taking beauty in mathematical models and arguments, the sort that you’d want to shout about from rooftops or have framed in a museum for posterity. Conversely, the process of building such a model or proof is eerily reminiscent of the scientific method: we try, we fail, we examine, we improve, we repeat; and occasionally, if fortune smiles, we enjoy a fleeting moment of inspiration.
I would love nothing more than to leave epistemological debates to philosophers and return to the warm comfort of my theorems. But there remains a lingering concern that if mathematicians don’t engage with such questions, then others will do it for us in ways that have profoundly detrimental ramifications for our subject. Short-sightedness has already led to either drastic down-sizing or wholesale elimination of “pure mathematics” departments at the University of Leicester in the UK and at Macquarie University in Australia. Perplexingly, in both cases the “applied mathematics” departments have been left largely alone and are somehow expected to thrive. Perhaps the people taking these decisions stand united in their belief that once Tantalus has been sliced in two along his waist, he will finally be free to pursue all of his strategic priorities.